What next for the Dow Jones Industrial Average (DJIA) index?

Common stock market sayings

Since November last year the Dow Jones Industrial Average index (DJIA) has risen from just under 18,000 to hit an all-time high of 22,000. However, just lately we have seen a bout of profit-taking amid political volatility and concerns about the short to medium term performance of the US economy. The market now stands at 21,667 which is still a significant increase from November last year but where next for the DJIA?

Next support………..

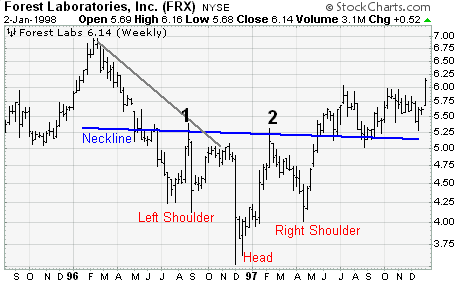
The index graph seems to suggest the next support level is 21,500 which would complete a double top formation. Where the market would go after this is anyone’s guess at this moment in time but 21,500 could turn out to be a very important support level. There is no suggestion that the index will retrace its steps back down to the 18,000 level but there could be some way yet to go before this recent bout of selling/profit-taking is complete. Continue reading “What next for the Dow Jones Industrial Average (DJIA) index?”

Could you trade on graph trends and nothing else?

Stock markets

While there is no doubt that share price graphs have their place in the decision-making process, is it possible or sensible to trade purely and simply on graph trends? Could you make money by detaching yourself from the underlying fundamentals and listening to what the markets have to say and nothing else? This is an interesting tactic which many people use for short-term gains and one we will look at below.

Trends change

Very often it will depend upon your risk profile but the emergence of say for example a “double top” pattern may look like a totally different trend in its early days. Before you know where you are, the share price has moved and looking back at the graph it was “obvious” it was a double top formation. There is no risk-free way to invest money, the markets will not deliver returns without effort but learning to read what the markets are saying is a vital skill. Continue reading “Could you trade on graph trends and nothing else?”

Head and shoulders chart patterns

Head and shoulders bottom (reversal)

The head and shoulders chart patterns are perhaps the best-known amongst those who use charts as a means of identifying trends. We will now take a look at the head and shoulders top (reversal) as well as the head and shoulders bottom (reversal) which offer similar patterns but a very different direction for the underlying share price.

Head and shoulders top (reversal)

Before a head and shoulders top (reversal) pattern can crystallise there needs to be a significant uptrend in the underlying share price. As the name suggests, the pattern created is similar to a left shoulder, head and right shoulder together with a neckline which offers both support and resistance. Continue reading “Head and shoulders chart patterns”

Common share price graph trends

Momentum trading

The practice of using share price graphs to try and predict future movements is one which attracts controversy and praise in equal measures. The fact is that graphs do offer an interesting indicative snapshot of how a share price is currently performing compared to its historic movements. Breakouts and resistance levels can also be highlighted so, while not everybody believes in using share price graphs, they do have a place in the investment arena. We will now take a look at some of the more common chart patterns.

Double top (reversal)

The double top (reversal) is one of the more common chart patterns which you will come across. It occurs after a share price has increased dramatically and then hits a level which attracts sellers. During on average the next month the share price will trade just below the recent high and then make a play for a new high. This is when a double top (reversal) can occur when the share price runs out of steam and after reaching the previous high we then see a drop. Continue reading “Common share price graph trends”