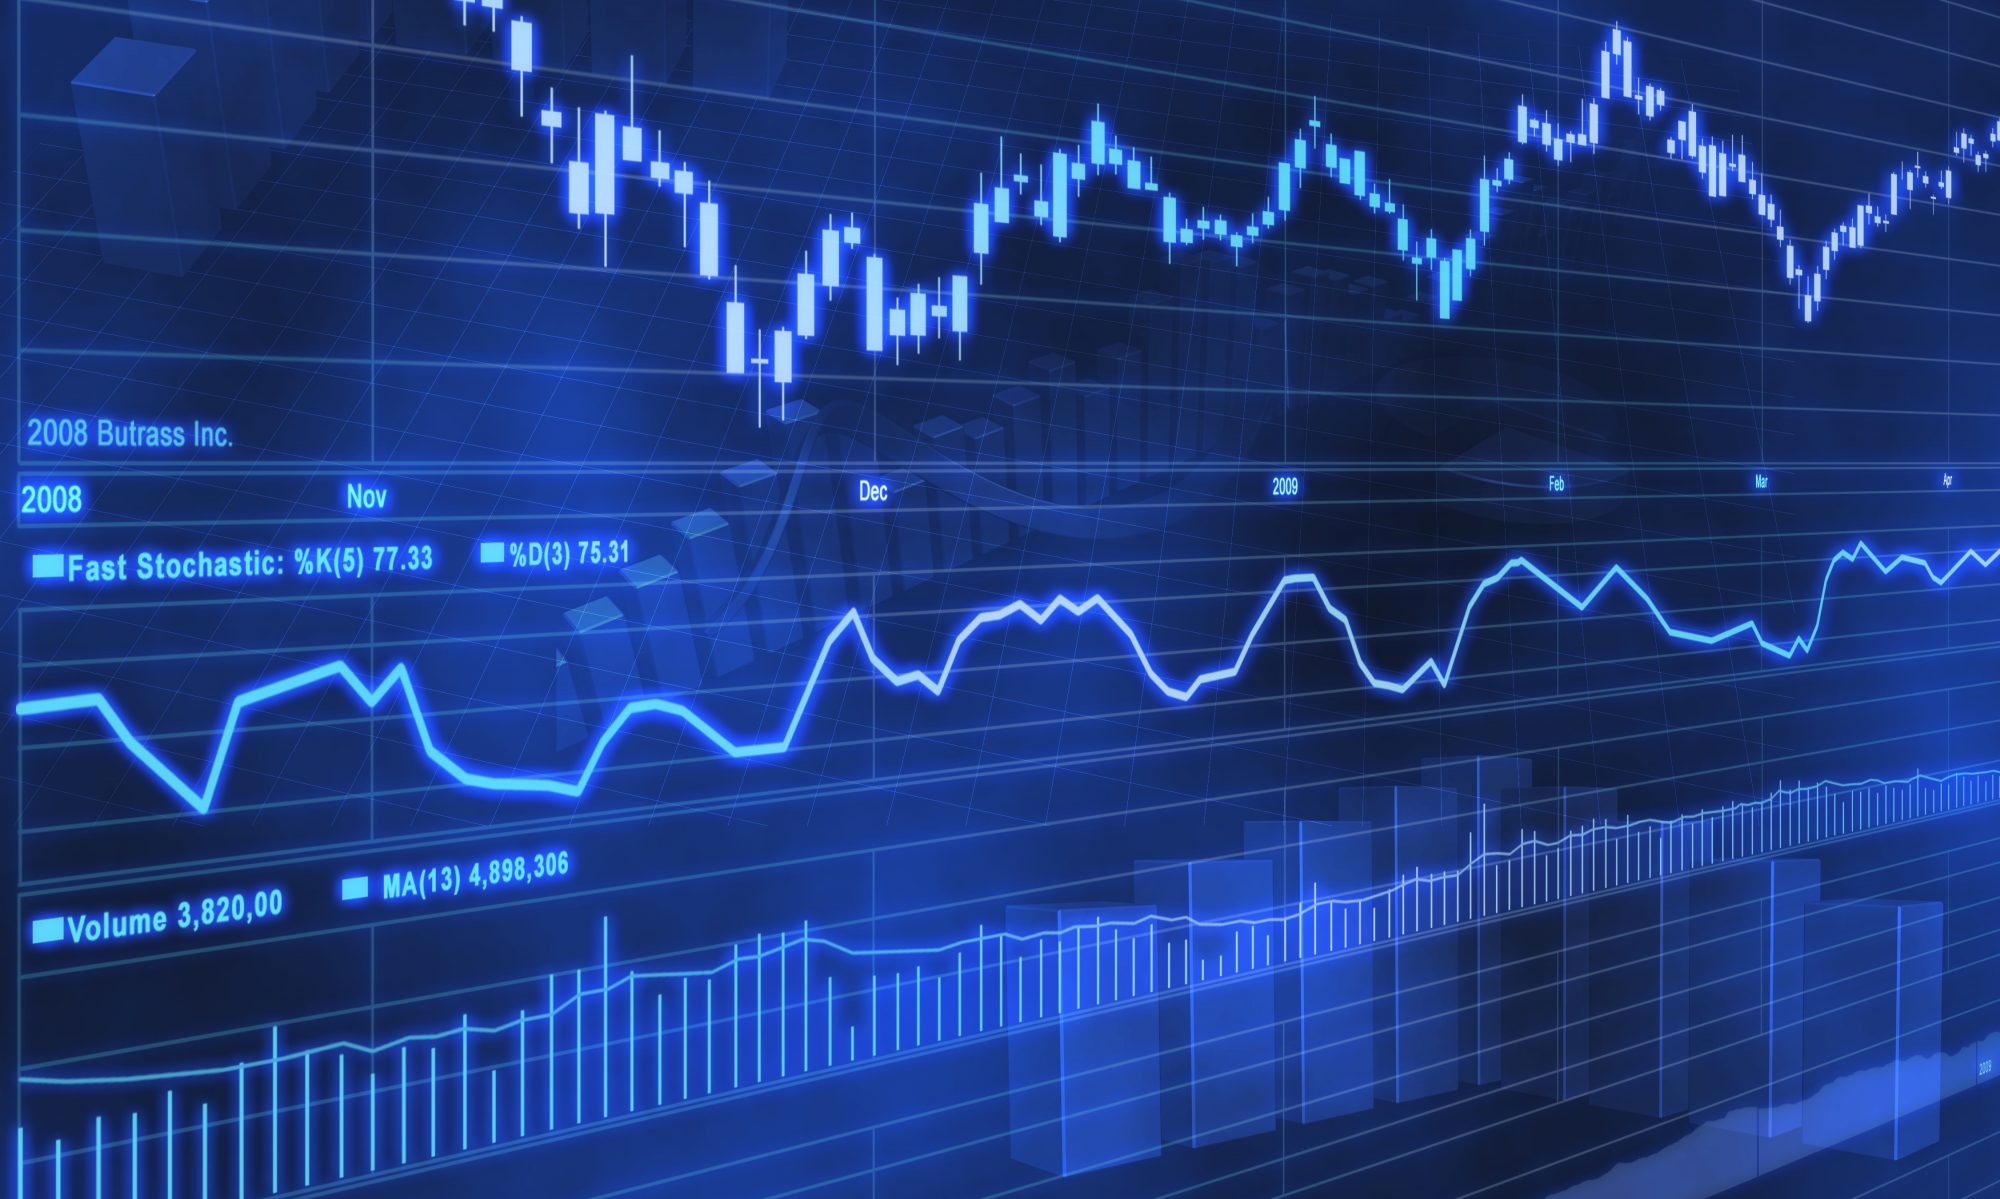

The use of graphs and trends in share prices are being used more and more by both professional and private investors. They do offer a useful means of tracking share prices, indicating the creation of possible trends although in reality they are more useful when analysing historic data. We all know that trends are repeated time and time again within similar environments and it is possible to identify the emergence of a trend at a relatively early stage and act accordingly. However, are graphs just self-fulfilling prophecies?
Is the tail wagging the dog?
It is maybe a little unfair to suggest that graphs are self-fulfilling prophecies but sometimes there can be an element of this when the investment herd gets behind a particular trend, a crossover point on a graph or a change in direction. Talk of double tops, head and shoulders, etc can on occasion prompt investors to act in a certain manner which simply creates the environment where the expectations of a certain movement are met. Continue reading “Are graphs just self-fulfilling prophecies?”